Google Analytics 4: A guide to the Traffic Acquisition Report

Learn how to access traffic acquisition data in GA4 in a few easy clicks, then how to go deeper by slicing and dicing that data.
Want to know how much traffic came from organic search? No problem. You can pull that report in two seconds flat! Or, even better, you’ve got it bookmarked.
But when it comes to Google Analytics 4, things look and feel different. You may have no idea how to get started.
Have no fear!
In this guide, you’ll learn
- How to access Acquisition reports in GA4.
- What the differences are between User acquisition and Traffic acquisition.
- How to build some of the most useful acquisition reports that you know and love from Universal Analytics in Google Analytics 4.
Where to find the GA4 Acquisition Reports
Acquisition reports live under Reports > Lifecycle > Acquisition.
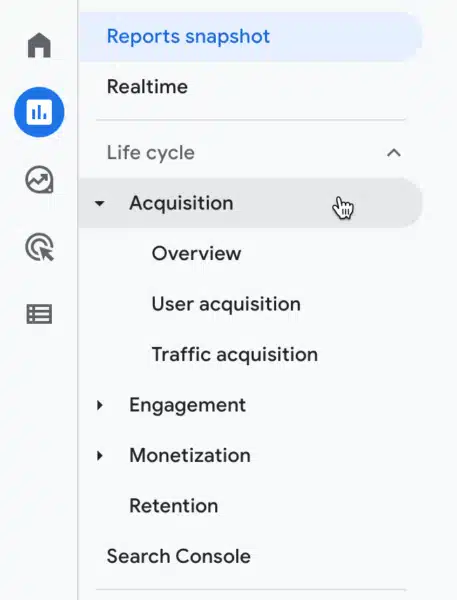
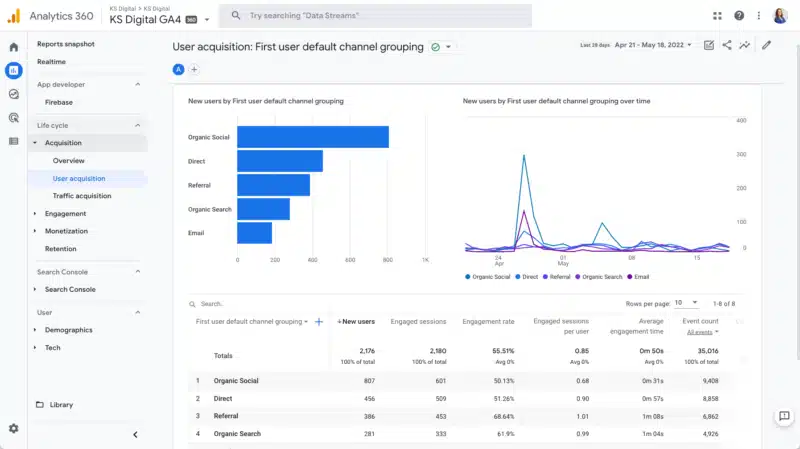
You’ll immediately notice that there are actually two acquisition reports.
The User acquisition report:
And the Traffic acquisition report:
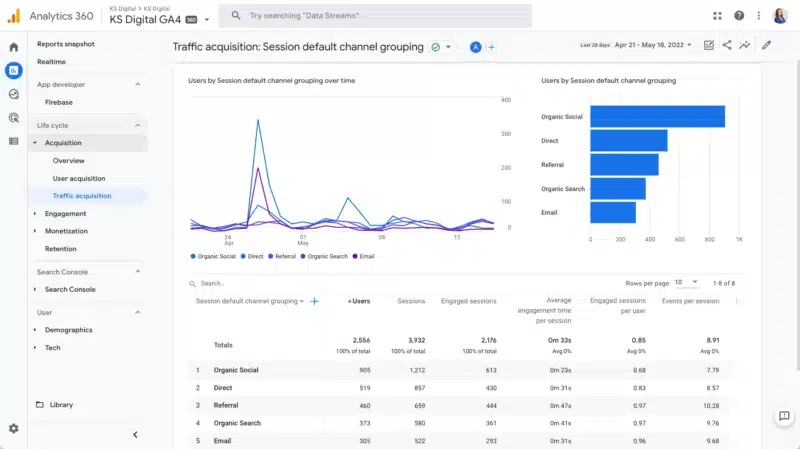
Important differences to keep in mind:
- User acquisition: the first campaign/source/medium observed for the user (or more accurately, for the browser/cookie)
- Traffic acquisition: the campaign/source/medium of the session – this will be most similar to what you are used to in Universal analytics
Which one should you use?
That’s up to you and the type of analysis you’re trying to do (whether you want to know what brought the user to the site in the first place, or campaign information for the latest session that brought someone to your site).
In this guide, we’ll examine the Traffic Acquisition report.
Using the Traffic Acquisition Report
When you select the Traffic acquisition report, you’ll notice that the report defaults to the Default Channel Grouping view of data.
In UA, you could select a Channels report to get this view, or you could choose to look at the “source / medium” report directly. In GA4, you can get all of these views from one single table.
To do so, you can change the primary dimension in the dropdown of the table to switch the dimension view.
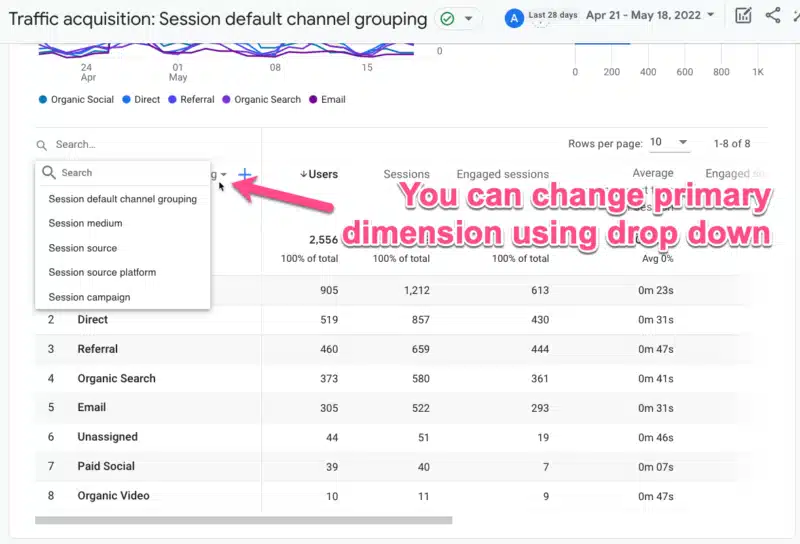
If you want to rebuild the source / medium report that we all love from UA, it’s easy.
First, you’ll change the primary dimension to source and then you’ll add a secondary dimension (click the + icon) of medium.
*Note that as of this writing, there is not a single primary dimension for source / medium, but there is a secondary dimension for it. Hopefully, this will soon be resolved in the GA4 reporting interface.
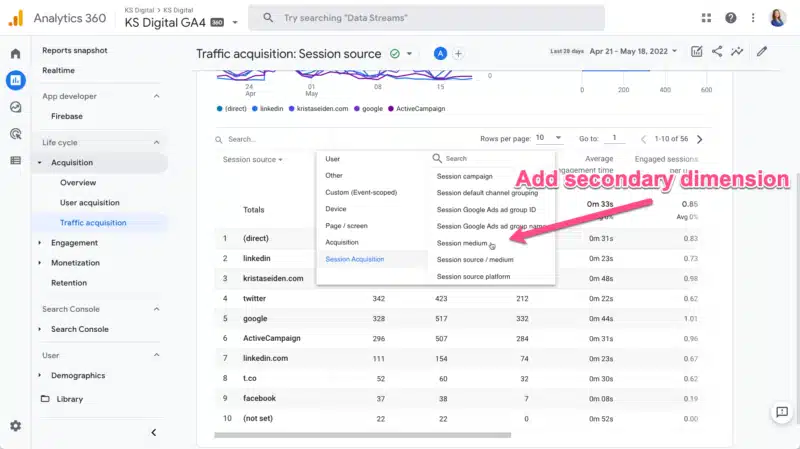
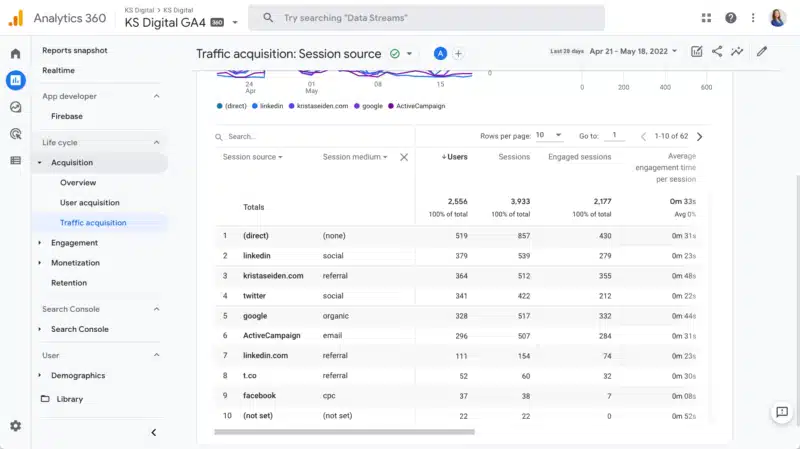
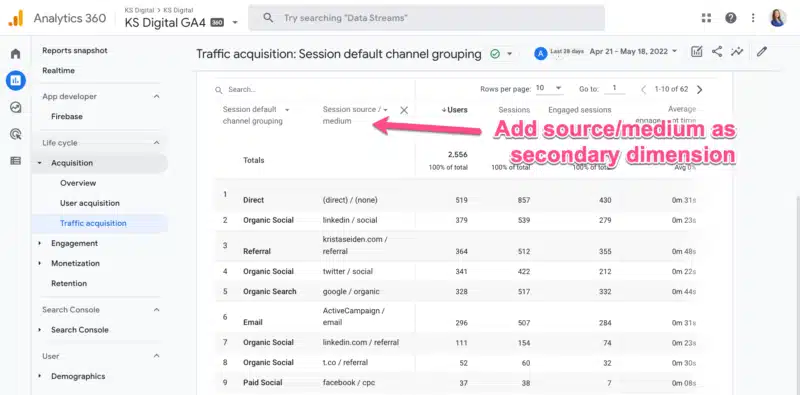
If you’d like to get a little fancier with your data analysis, you can leave the primary dimension set as is as Default channel grouping and add a secondary dimension of source / medium.
It’s a nice view to see high-level Default channel grouping and the more granular source / medium breakdown together, giving you the ability to easily scan and classify traffic into channels and distinct sources.
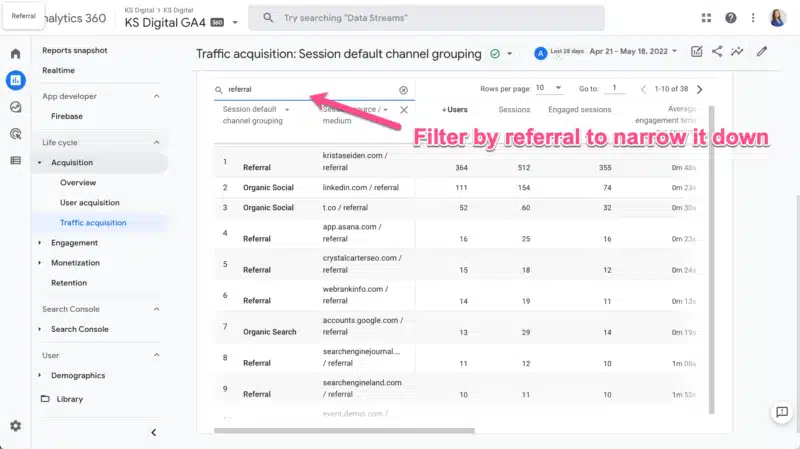
Similar to Universal Analytics, we can also filter a table report in GA4.
For example, if you’d like to filter by Referral, you can use the filter box to narrow down your data results.
One important difference between GA4 and UA is that the filter you add here will apply to both the primary and the secondary dimensions in the table.
So if the word “referral” shows up in either column, the row will be shown. In UA, the simple filter box only impacted the primary dimension, and you could add an advanced filter option for the secondary dimension specifically.
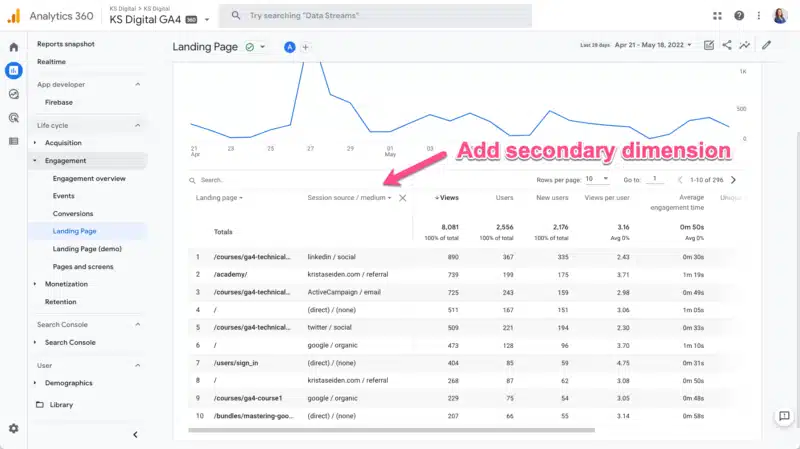
If you want to know acquisition data by landing page, you can apply this same methodology of adding a secondary dimension of source / medium to your fancy new landing page report we recently built.
If you haven’t done it already, here’s how you can easily build your own landing page report in GA4. It’s a handy tool for search marketers.
Now you’re a GA4 acquisition master
That’s it! And it isn’t all that different from UA.
With a little practice, you’ll be pulling those acquisition reports with your eyes closed.


